Eclipse/steady — Monitoring and logging components
Having a good log and monitoring infrastructure becomes a key feature that allows sysadmins, support teams, and even developers to be more prepared to face these possible operational problems and address problems in the code base more efficiently.
Scalable application monitoring with Prometheus
Metrics, unlike logs, are a measurement at a point in time for the system collected at a fixed-time interval and not collected per event. As such, it is the fundamental building block of application monitoring allowing for an objective overview of the health of the given system.
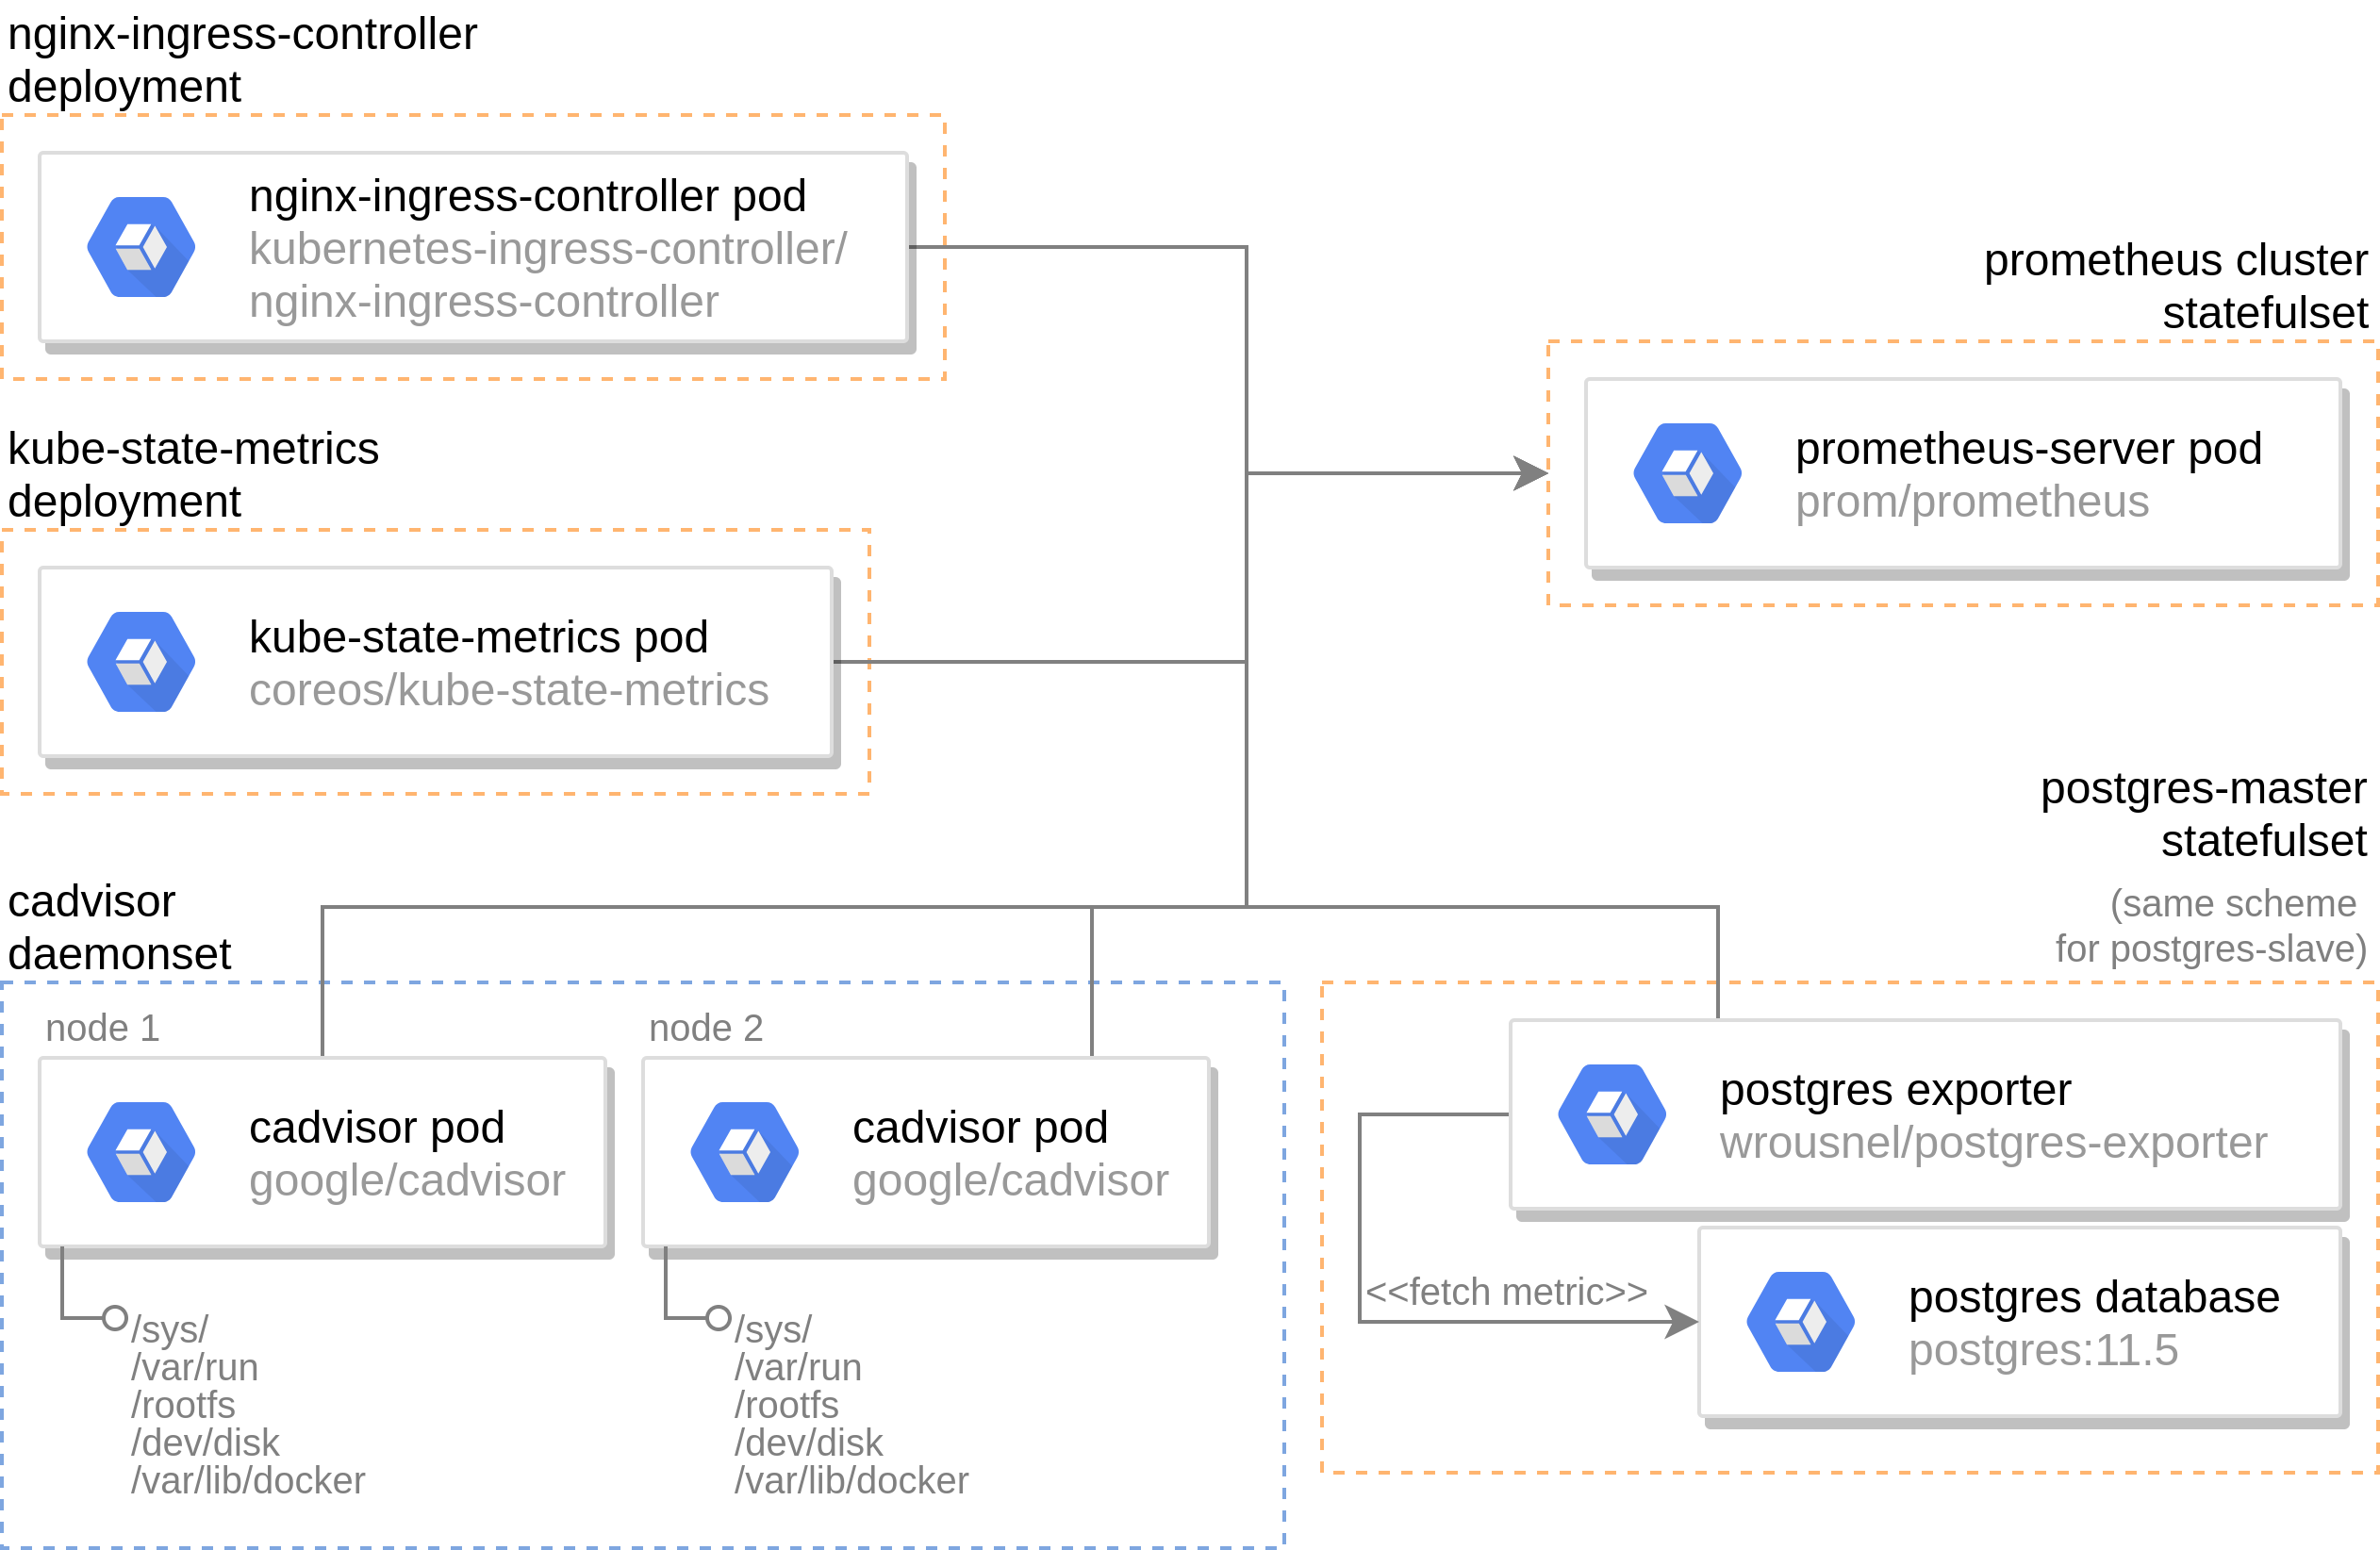
Prometheus is the metrics and alerting server with the highest amount of adoption and integration for k8s which is going to be used in our case. It relies on a set of exporters (components to export specific metrics) to run on the desired instance and send it back to the server to be aggregated. After a brief discussion about the required metrics, the following exporters are included in the deployment:
- cadvisor: provides information regarding the resource usage and performance of containers. It should be run as a daemon set on each node as it only fetches data on the node on which it’s hosted and extremely lightweight (20MB). A couple major downsides of this component are that it offers an unwanted mandatory UI that consume resources and requires root privilege (reading from /sys/ and /rootfs/) to function.
- kube-state-metrics: exposes k8s cluster level metrics such as allocatable cpus per node. Only a single replica is required because it communicates with the k8s API.
- postgres-exporter: publish metrics about the PostgreSQL database (such as replication lag, most used queries, etc…). This component is integrated as sidecar container to the postgresql database container.
- nginx-ingress-controller: metrics endpoint already available in the ingress controller deployment which allows for monitoring request latency and HTTP responses.
It is important to note that the monitoring architecture (see Figure below) has not been altered from the docker-compose based deployment albeit with the addition of cluster metrics.
Log pipeline implementation
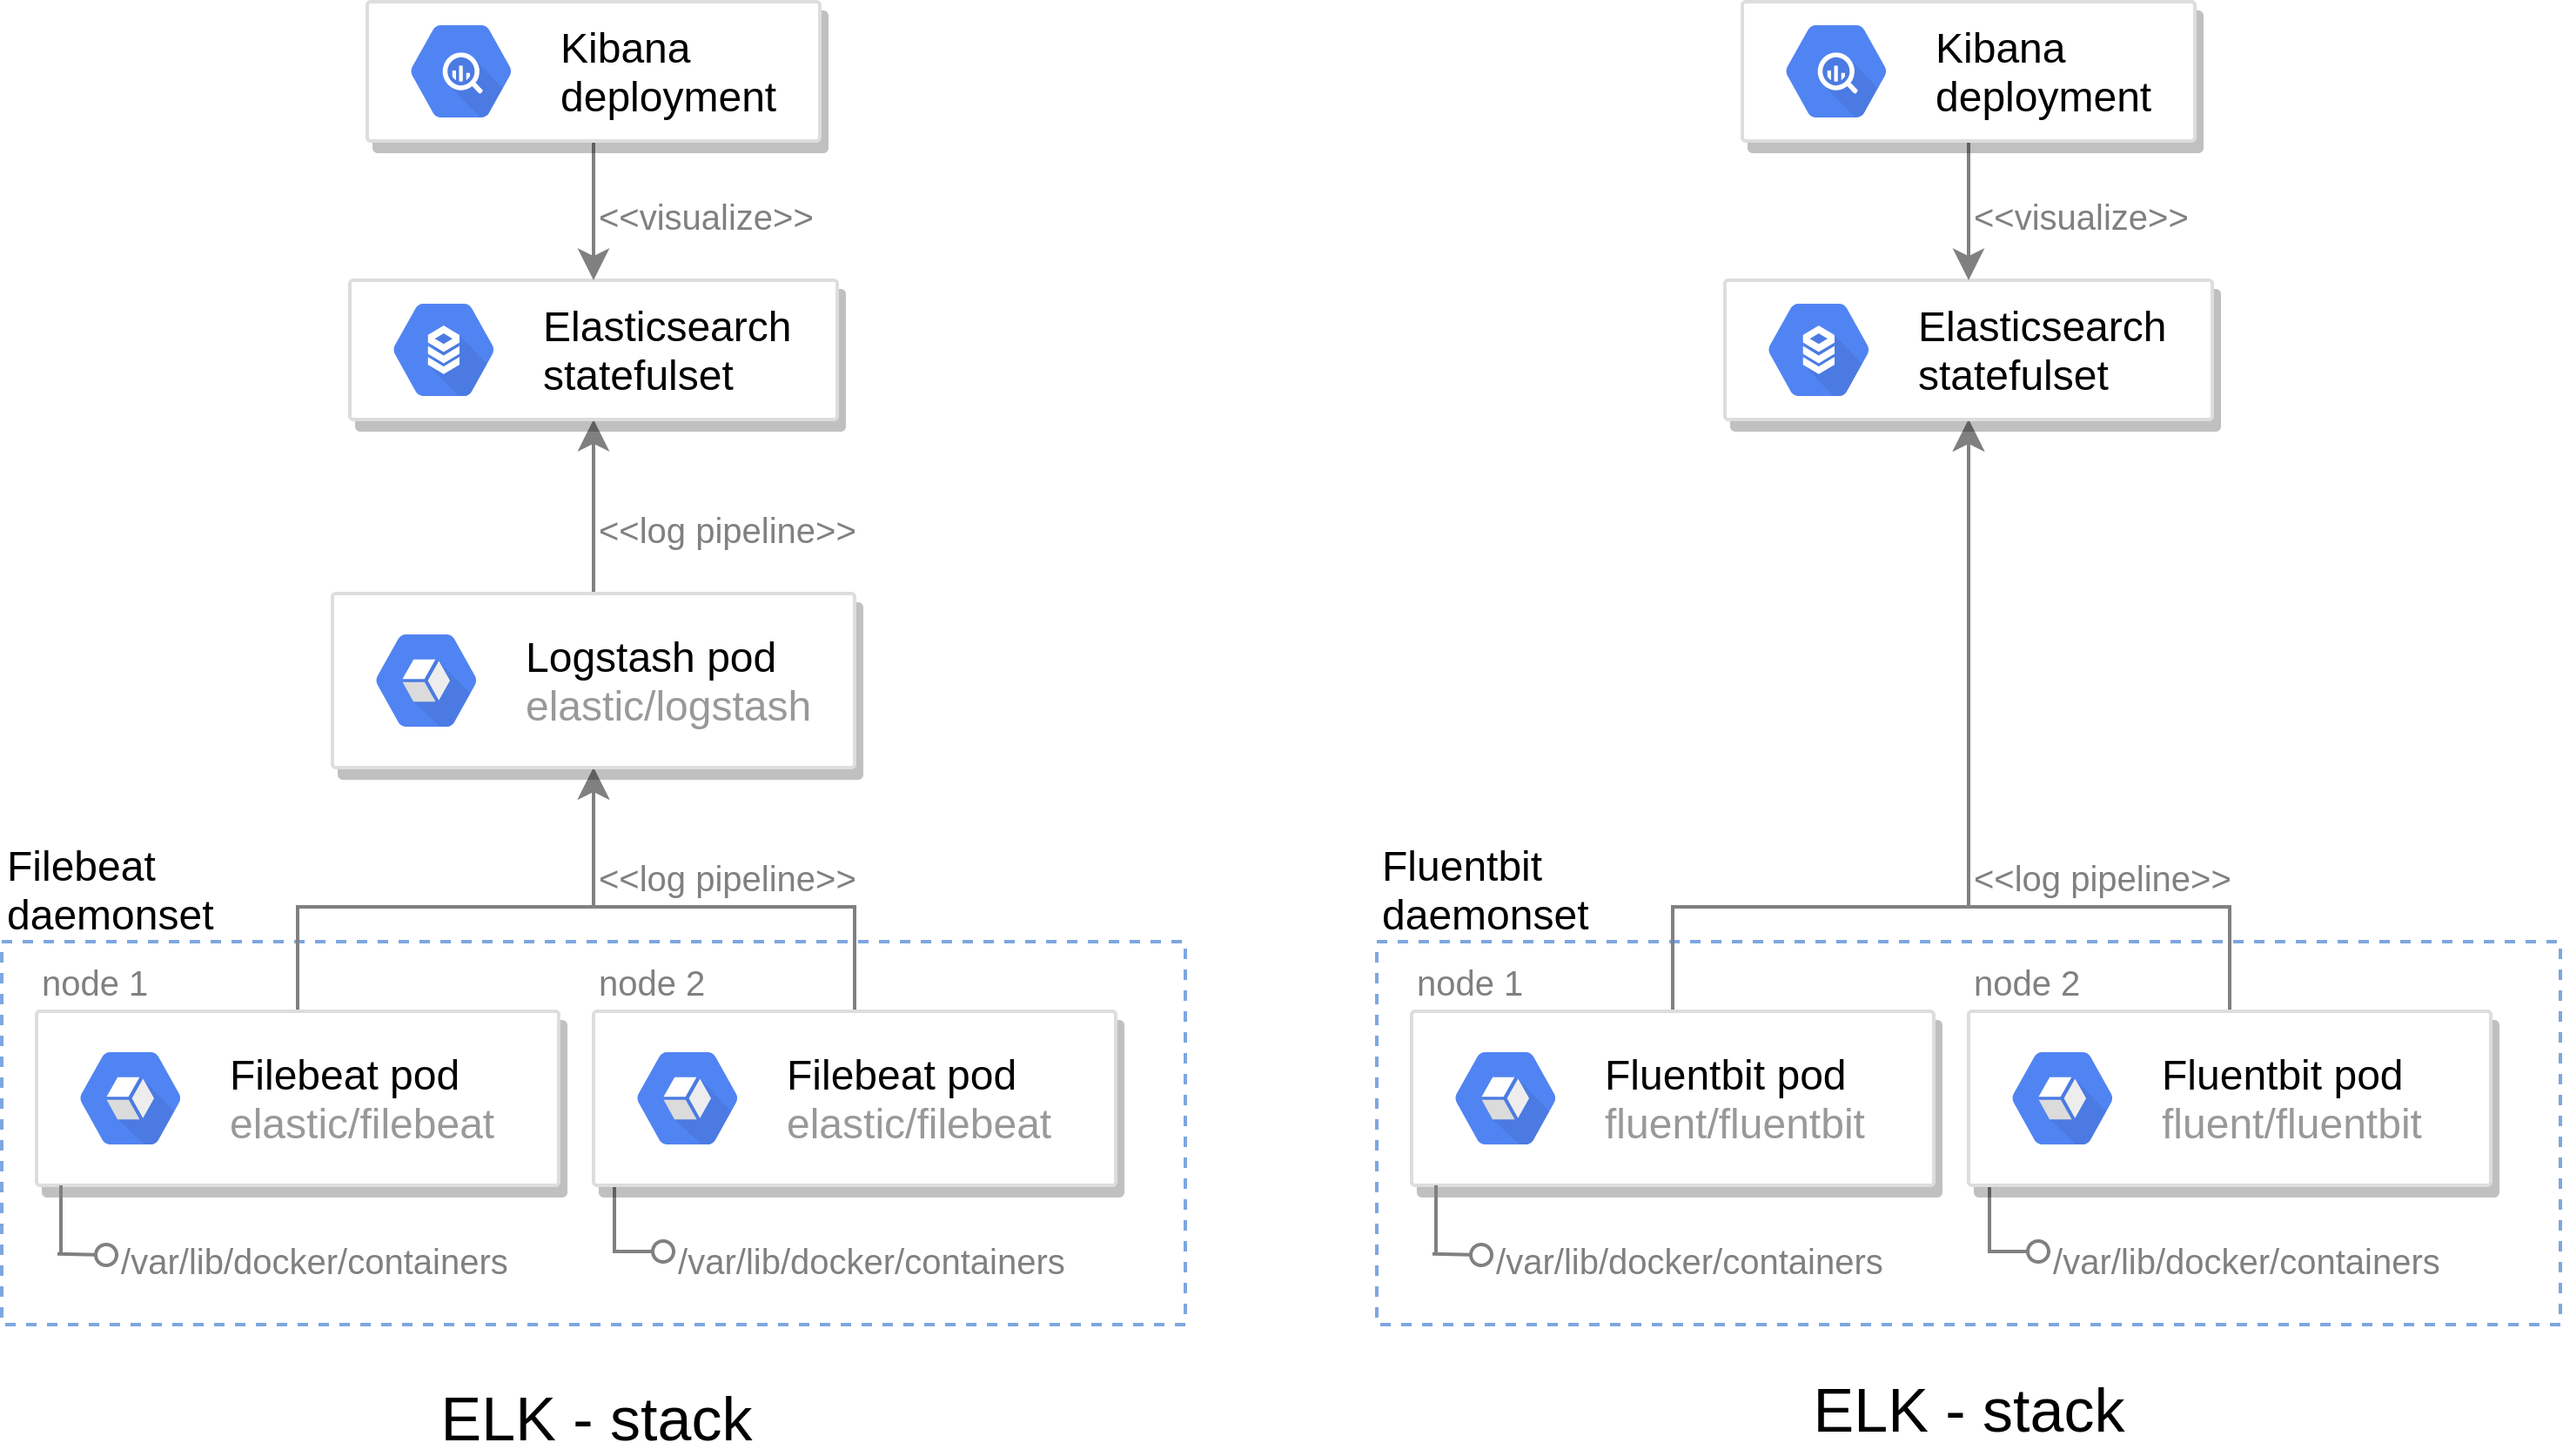
The traditional solution to this question is the ELK stack (Elasticsearch, Logstash, Kibana) which it composed of four components; Filebeat which ships logs from the host machine to Logstash, which aggregates and filters them before loading them into Elasticsearch, a database which can be fed into Kibana to create meaningful visualizations and time series analysis.
Although this solution is conventional for docker-compose based architecture, it can be problematic in the k8s context because of Size. Filebeat has to be run as a daemonset and thus a container must be present in all machines of the cluster. The filebeat container has a significant footprint (around 100MB, due to it being in Java and requiring the corresponding JVM) and can in no way be considered lightweight.
The EFK stack is chosen because it mitigates this issue, by replacing both Logstash and Filebeat by Fluentbit, a lightweight (20MB) log shipper written in C that doubles as a filter which creates a pipeline from the host machine directly into Elasticsearch.
Metrics and logs visualization
For visualizing metrics, Grafana is an open source analytics and monitoring solution for every database which is perfectly adapted to creating meaningful dashboards for prometheus metrics. The large community behind the project has done the hard work of creating dashboards for all use cases which can be imported as a JSON. Therefore the work in creating a meaning visualization adapted for our use case is just a matter of importing this file and modifying some metric names which are prone to change over different versions and release of the exporters.
When it comes to logging, in agreement with the vulnerability-assessment-tool team, a Kibana dashboard is not within the scope of this internship. Nonetheless, live tailing logs is a mandatory requirement. The centralized log infrastructure proposed above is not real time so a workaround has to be devised. Unlike a non cloud deployment, in a k8s environment, a container can be running on a multitude of different nodes and the workload can be divided to different containers. Due to this complexity, there are currently no viable infrastructure based solutions to this demand.
Shifting the scope of the search to a more contributor/developer side solution yielded stern, a CLI tool written in Golang that uses the kubectl CLI and a set of simple arguments to filter out the appropriate logs. As is the case with a lot of libraries, the code design is not thought out for integrating in other Golang projects so we decided to create a Bash wrapper script which fills in the appropriate arguments for the desired containers.