Cloud Provider benchmark
This benchmark is done in order to help in the process of deciding which public provider to migrate to. Three public cloud offers are studied (GCP (Google Cloud Platform), AWS (Amazon Web Service) and Microsoft Azure) in comparison to the private solution.
Computing offer comparison
It is important to note that all the aforementioned providers have support for Linux as well as Windows VMs. Although terminologies vary widely between providers (machine type for GCP, instance for AWS, VM for Azure), they all provide a couple of essential categories of common machine families. This benchmark of computing offers will focus mainly on the spread and diversity of computing instance offers through the lens of the computing ratio variable (amount of vCPU per GiB of memory). Using different methods of dynamically fetching the different computing instance offers from the cloud providers, we examined the following family types:
- General purpose instances provide a balance of compute, memory and networking resources, and can be used for a variety of diverse workloads. These instances are ideal for applications that use these resources in equal proportions such as web servers and code repositories and are offered by all of the aforementioned providers.
- Memory optimized are ideal for tasks that require intensive use of memory with higher memory-to-vCPU ratios than the N1 high-memory machine types. These machine types are suited for in-memory databases and in-memory analytics, such as SAP HANA and business warehousing (BW) workloads, genomics analysis, SQL analysis services, ….
- Compute-optimized machine types are ideal for compute-intensive workloads.
The instance performance (vCPUs, memory(GiB)) and family type are then computed in order to generate boxplots with the preferred grouping (by cloud provider, by family, etc…).
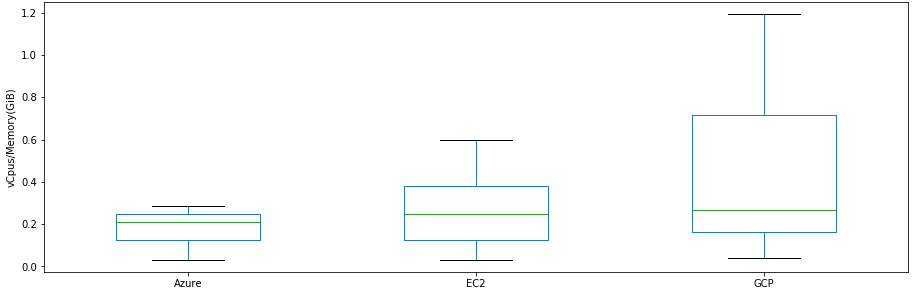
Boxplot of compute ratio per cloud provider
A comparison of the computation/memory ratios between providers shows that GCP has the most diverse offers when it comes to vCpus/Memory despite having a lower amount of machine types than other providers. It is also noticeable (within the given dataset) that GCP and AWS EC2 tend to offer a higher Computation/Memory ratio than Azure whose spread is the lowest.
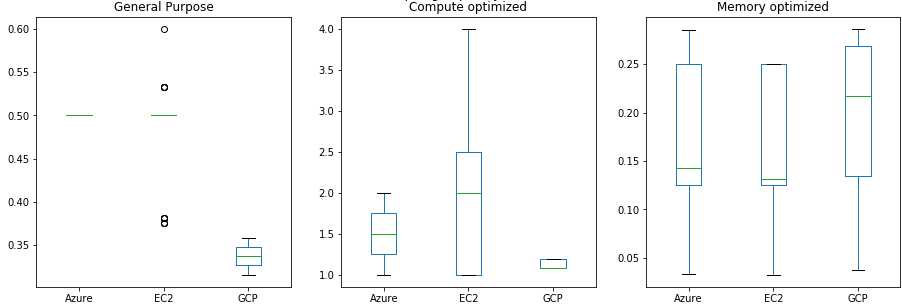
(a) Boxplot of compute ratio per cloud provider class
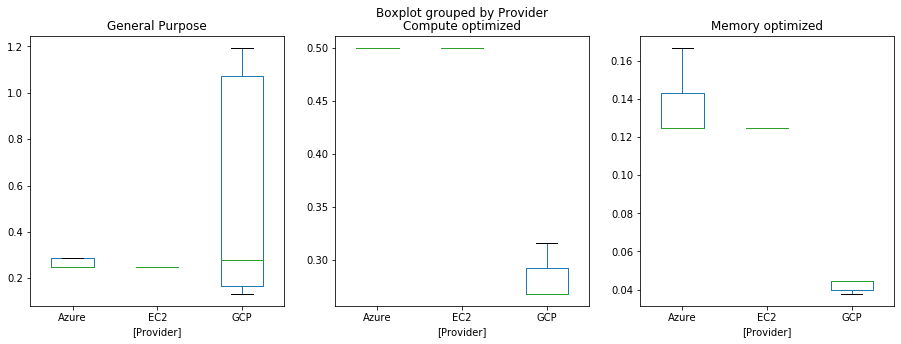
(b) Boxplot of compute ratio per cloud provider grouped by ratio
Outliers excluded, GCP General Purpose seems to offer the most variety, however their Compute optimized and Memory optimized offers are quite lacking compared to their counterparts. This is more telling of a different nomenclature between the cloud providers and does not grant us much insight into the diversity of their offers.
By applying the classification labels to the actual ratio, we get a more complete picture. AWS excels in compute optimized instance in comparison to other providers whereas GCP and Azure take the lead in memory optimized instances. On the other hand, with general purpose machines, AWS maintains a higher spread ratio whilst GCP mainly focuses on the lower proportion of the spectrum.
Hosted database offers
In this section, the different cloud providers will be used as the backbone for comparing the advantages and drawbacks of using a hosted database rather than running a self administered database cluster in k8s. Specifically a version of the vulnerability-assessment-tool database will be loaded onto a hosted database instance (with or without replication) and a self administered k8s cluster to compare their price, migration cost as well as their operational cost.
Cost
In order to establish a proper price comparison, a set of different cases for resource consumptions are defined:
- Lightweight HA : the cluster is instantiated with no prior scan and data, then, the bugs are loaded using the patch-analyzer. This deployment is not destined for high availability or resilience (therefore with less replicas, no auto-scaling) and is optimal for small testing environments with a 6 month usage buffer with the sufficient amount of replicas that will ensure high availability and resilience.
- Medium Load HA : the cluster is instantiated with no prior scan and data, then, the bugs are loaded using the patch-analyzer. This deployment is not destined for high availability or resilience (therefore with less replicas, no auto-scaling) and is optimal for small production environments with a 2 year buffer with the sufficient amount of replicas that will ensure high availability and resilience.
- Production Load HA : the cluster is loaded with the latest dump of the internal SAP vulnerability-assessment-tool database (which at the time of this document creation is around 350GB). This deployment is not destined for high availability or resilience and is optimal for production environments with a 3-5 year usage buffer. This data load includes app specific data (once those are removed, the database size is around 150GB in our current setup) with the sufficient amount of replicas that will ensure high availability and resilience.
- Hosted DB : for using a pre-existing database (for cloud providers such as GCP, AWS, Azure, etc…) which require lower resources as the database are no longer self managed.
From each of these deployment case, a range of resource list is calculated; from the minimum to the maximum amount of CPU and Memory (GiB), the amount of Persistent Volumes (GiB) and the cost of the hosted database instance if required. Then using GCP cost calculator, the cost for each case is computed. Note that this methodology overestimates by a big margin the cost of computing resources (CPU, Memory) because it assumes that all machines will consume 100% of the allocated resource continuously (24/7) for one month. Mapping the appropriate deployment cases to its PVC size, the relative difference in cost between a hosted and non hosted HA deployment can be measured using the estimated cost range.
The price comparison is applied in two regions, eu-west-2 (one of the most expensive regions in GCE) and us-central-1 (one of the cheapest regions in GCE), to establish a possible evolution range of the difference in cost. In both cases, the hosted deployment becomes profitable over the self managed cluster when the data load surpasses 200GB.
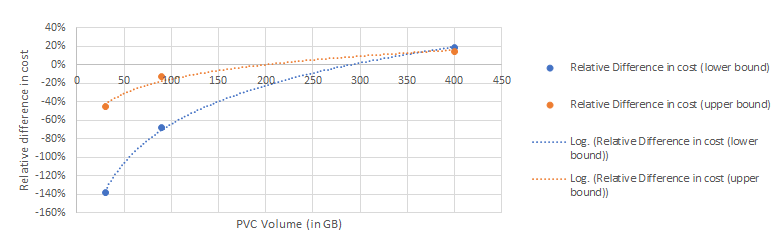
(a) eu-west-2
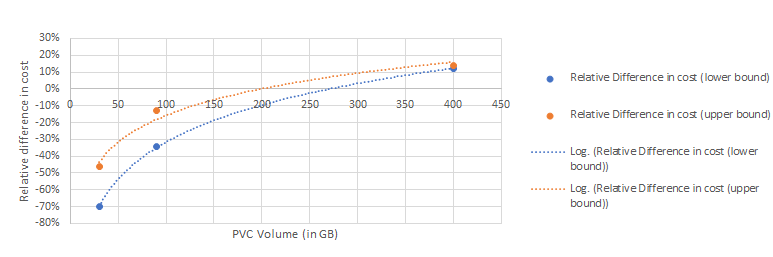
(a) us-central-1
Services
Unlike self managed database clusters, snapshots, backups and maintenance windows are options which can be added for most hosted database offer by cloud providers without extra operational cost (testing, developing and maintaining these scripts). However the most interesting feature is database storage auto resizing which ensures its vertical scalability. The hosted database service main drawback is that root access is not allowed, so in order to migrate from an external database, the dump has to be done without owner or privileges. This minor setback is however minuscule compared to the advantages cited previously.
Performance
The performance benchmark is run on each cloud provider (each with comparable amount of resources) with the full vulnerability-assessment-tool production workload (350GB of data, without trimmed application and space related data) against a script of read-only requests (same script and pgbench parameters below.
- GCP (helm): using the self managed HA postgres with replication and pooling
- GCP (cloudSQL non optimised): using the CloudSQL Postgres offer with no production configuration and only a single instance without read replicas
- GCP (cloudSQL optimised): using the CloudSQL Postgres offer with production configuration and only a single instance without read replicas
- GCP (cloudSQL optimised): using the CloudSQL Postgres offer with production configuration and only a single instance without read replicas and 400GB of SSD (increases IOPs drastically over the bare minimum at 257GB)
- GCP (cloudSQL optimised, 1 replica): using the CloudSQL Postgres offer with production configuration and only a single instance with read replicas and pg_bench querying a pgpool statefulset with 3 replicas.
- AWS (helm): using the self managed HA postgres with replication and pooling
- AWS (rds non optimised): using the RDS PostgreSQL offer without implementing production configuration and only a single instance witout read replicas
- AWS (rds optimised): using the RDS PostgreSQL offer with production configuration and only a single instance without read replicas
- AWS (rds optimised, 1 replica): using the RDS Postgres offer with production configuration and only a single instance with read replicas and pg_bench querying a pgpool statefulset with 3 replicas.
- Azure (helm): using the self managed HA postgres with replication and pooling
- Azure (hosted non optimized) : using the RDS PostgreSQL offer without implementing production configuration and only a single instance witout read replicas. However, due to the lack of possible configurations (most configuration listed below being unavailable or unchangeable), the optimized version will not be represented.
Reproduction steps:
- Create the database cluster on SAP’s Converged Cloud based on three machines, each mounting a 400GB PVC provisioned by Openstack Cinder:
- 1 * 24560MB RAM, 24 VCPU, 64GB disk hosting the master database
- 2 * 16368MB RAM, 16 VCPU, 64GB disk hosting the replicas
- Use the previous machines as a node pool for running k8s (version 1.15.2) and a 16GiB, 8vCPUs machine from which to run the benchmarking tool.
- Load the production database:
- Total size: 354 GB
- Tuples inserted: 412369404
- Amount of tables: 30
- Run the pgbench tool as a k8s scheduled job within the cluster (on a distinct node from databases) with the following specs (Scaling factor: 1, Query mode: simple, Number of clients: 80, Number of threads: 8, Script: sample of read queries (with varying complexity) representative of the overall population of queries to the real life work load).
- production configuration:
temp_file_limit: 48593190
work_mem: 64
maintenance_work_mem: 1024
max_connections: 100
random_page_cost: 2
autovacuum_max_workers: 8
log_autovacuum_min_duration: 1
autovacuum_analyze_scale_factor: 0.15
Note that as the performance of the Azure deployment is too poor (being the outlier in every case and making the charts non exploitable), the charts shown below do not include Azure. Due to the fact that the helm chart has been developed and optimized for Converged Cloud, its performance will likely be better than other test cases. In order to not overclutter the charts, the following colour coding convention is used:
AWS
Azure
GCP
| provider | helm | hosted | optimised | replicated | bigssd | mean latency |
|---|---|---|---|---|---|---|
| azure | x | 1.9E+04 | ||||
| gcp | x | 1.3E+04 | ||||
| aws | x | 1.2E+04 | ||||
| ccloud | x | 8.1E+03 | ||||
| gcp | x | x | x | x | 1.0E+04 | |
| aws | x | x | x | x | 1.2E+04 | |
| gcp | x | x | x | 1.0E+04 | ||
| azure | x | x | x | 6.9E+04 | ||
| gcp | x | x | 1.0E+04 | |||
| aws | x | x | 1.2E+04 | |||
| gcp | x | 4.2E+04 | ||||
| aws | x | 4.6E+04 | ||||
| azure | x | 7.1E+04 |
Average latency (ms) per deployment setup
It is demonstrable that using the cloud provider database as a service offer using naive configuration (without tailoring it to the production workload) is detrimental, as for AWS, GCP as well as Azure the query latency is almost 4 times the naive helm chart deployment.
On the other hand, with replication and tailored production configuration, the hosted database offer certain performance gain as well as price benefits (lower overhead cost as well as base cost). On the other hand, since performance can be gained using bigger SSDs (increased IOPs), one can use this to optimize the database, but an increase of 100GB in the ssd size won’t offer much of a gain in latency (as seen by the similar outcomes for big-ssd deployments).
| count | mean | std | min | max |
|---|---|---|---|---|
| 10 | 0.002609 | 0.000599 | 0.000152 | 0.002742 |
Relative difference statistics between deployment and reference
These query latencies are not affected by the network latency, nor by the speed of the connection establishing due to the fact that the relative difference between tps (transaction per second) with and without handshake is relatively low: with a mean of 0.0026% and a standard deviation of 0.0005 points.
Grouping by complexity (arbitrary decision on the mean of all latency results for all providers), confirms the fact that GCP optimised seems to be the one whose performance in most case closest and some cases better than the CCloud native helm chart. The sample of query given do not however represent the frequency of their usage, therefore, a weighted approach (with usage $frequency \times cost$ ) would give a better approximation of the actual performance of the vulas database in each scenario. It would also be interesting to group the queries into their operation type (for instance seq_scan, index_scan, nested_loop, etc.) in order to gauge the performance of the database for each operation per cloud provider.
Performance benchmark
In order to evaluate in an unbiased manner the performance of each cloud provider, we’ll base ourselves on the PerfKitBenchmarker (set of benchmarks to measure and compare cloud offerings developed and open-sourced by GoogleCloudPlatform) for Database, Networking and Instance performance and perf-test (performance test kit for kubernetes deployments) for provided control plane performance.
Reproduction environment
| Provider | Default Zone | Machine Type | vCPUs | Memory (GiB) |
|---|---|---|---|---|
| GCP | us-central1-a | n1-standard-1 | 1 | ∼3.5 |
| AWS | us-east-1a | m3.medium | 1 | 3.75 |
| Azure | eastus2 | StandardA1 | 1 | 2.1 |
Default reproduction environment for PerfKitBenchmarker
Note that the previous machine types may vary slightly depending on the test applied (due to different resource requirements). The default machine type is meant to be as close together as possible, however Azure’s machine type is a bit less performant than the others, which might disadvantage it. AWS should however profit from this disparity during the benchmarks.
On the other hand, all regions tested are within the US, so comparable results should be observed and the regional factor should not influence the results.
Computing instance
The cloud provider instance performance can be evaluated thanks to aggregating data from the unixbench benchmark group which cover tests ranging from computing, pipe performance, system calls, to unix file copies.
Basic arithmetics
Drystone is a synthetic benchmark application meant to mimic a real life application with a mix of mathematical and other operations (with the following specifications: Integer performance predominated, with little or no floating-point calculations, and could be contained inside small memory subsystems). This benchmark, although lightweight and quite portable, is susceptible to compiler optimization interference (as it is written in C) and only captures a tiny fraction of mathematical and basic operations. Because these inherent flaws are also present in the Wheststone test, data from these benchmarks are excluded.
Pipe throughput
This test (composed of two tests Pipe throughput and Pipe-based Context Switching) intends to evaluate pipe performances (A pipe being the simplest form of communication between processes) by measuring the amount of lines executed per seconds (lps).

| provider | pipe throughput(lps) | pipe based context-switching (lps) | relative performance ratio (%) |
|---|---|---|---|
| aws | 409657 | 73558.4 | 17.96 |
| azure | 366060.6 | 95920.7 | 26.20 |
| gcp | 1097697 | 137761.1 | 12.55 |
Pipe throughput is the number of times (per second) a process can write 512 bytes to a pipe and read them back. The pipe throughput test has no real counterpart in real-world programming. The context switching measures the number of times two processes can exchange an increasing integer through a pipe.
The pipe-based context switching test is more like a real-world application. The test program spawns a child process with which it carries on a bi-directional pipe conversation. The relative difference between pipe throughput and pipe based context switching (due to added the added complexity) is minimized in GCP’s case.
Shell and process calls
The process creation test measures the number of times a process can fork and reap a child that immediately exits. Process creation refers to actually creating process control blocks and memory allocations for new processes, so this applies directly to memory bandwidth. Typically, this benchmark would be used to compare various implementations of operating system process creation calls. The shells scripts test measures the number of times per minute a process can start and reap a set of one and eight concurrent copies of shell script where the shell script applies a series of transformation to a data file. Due to shell scripts extra complexity, it is expected that the performance would be lower that the pure process creation.

| aws | azure | gcp | |
|---|---|---|---|
| process creation (lps) | 4880.4 | 4647.4 | 110701 |
| concurentshell (lps) | 3339.7 | 3440.4 | 7771.78 |
| concurrentshell (lps) | 435 | 426.4 | 999.2 |
| performance lost from shell overhead (%) | -86.97 | -87.60 | -87.14 |
| performance lost from concurrent shell (%) | -31.57 | -25.97 | -29.79 |
Concurrent shell execution seems to be a road block on all providers as the execution speed in lpm (lines per minute) drop significantly (at the same ratio as the amount of concurrent executions). This however comes from the Linux kernel implementation as well as mutex locks on the data file and not from the cloud providers themselves. The performance drop due to concurrent execution is quite similar all throughout providers; the 8 concurrent shell execution having around 12% to 13% of process number finished of the single shell execution. The same observation can be made for the shell overhead. Despite the similar relative drops, the base process call performance of GCP remains the highest which, in turn, translates to their instances being the most optimized for shell and process calls.
Conclusion
Instance performances measured through the unix-bench kit show that GCP instances are the most optimized with AWS and Azure following closely behind. This difference possibly comes from different implementation of the base image; GCP using a Container Optimized OS based on Chromium OS, AWS using Amazon Linux AMI and Azure using the Canonical Ubuntu. However, this is mere speculations because the design documents for these images do not go into detail about their implementation.
Databases and filesystem performance
Fio — I/O speed
Fio is short for Flexible IO, a versatile IO workload generator. In this benchmark, each provider provision one equivalent machine type and performs a series of sequential or random operations such as reads or writes of a $10 \times 10 \times 1000$ mb file with a given block size in bytes (kilobytes) and a given iodepth (Number of IO operations is issues to the OS at a given time). This would give an idea of IOPs for each provider and the underlying performance of their file system. In detail, the disk access pattern benchmarked are the following:
- Random read: blocks of 4kb are read from random locations on the surface of the device at an IOdepth of 1. This access pattern is quite common during operating system startup, where lots of configuration and driver files must be read from the disk and can therefore give an insight into instance startup or reboot.
- Random write: blocks of 512kb are written from random locations on the surface of the device at an IOdepth of 1. This type of access pattern is common when running applications from a disk and also when copying large application directories.
- Sequential read: contiguous blocks of 4kb are read/write from adjacent locations on the surface of the device at an IOdepth of 1. This type of access pattern is common when reading large files.
- Sequential write: contiguous blocks of 512kb are read/write from adjacent locations on the surface of the device at an IOdepth of 1. This type of access pattern is common when writing large files.
- Random Parallel read: the fio process will try to submit 64 simultaneous I/O, each attempting to random write a 4kb blocksize.
With the above job config, fio gathers two metrics IOps and Latency per operation. The latter is used because it is richer, giving access to each percentile of the latency distribution.

(a) random read |

(b) sequential read |

(c) random write |

(d) sequential write |

(e) random parallel read
From this point onwards, two criterias are measured; Performance (characterized by the median latency ($p50$)) and Stability (characterized by the standard deviation of the sample).
Write operations
For random writes, all instances offer stable performance with a homogeneous percentile distribution (the difference between the 1st and 90-th percentile is relatively close). GCP excels in this category with a the lowest median (502 $\mu$s) and p95 (1608 $\mu$s).
For sequential writes, Azure takes the lead with a median at 31104$\mu$s. However, both AWS and Azure suffer from stability (with standard deviations over 7 times bigger that GCPs) whereas GCP’s is more stable with the highest median of around 444416$\mu$s.
Read operations
When it comes to sequential reads, Azure takes the lead on performance but GCP overtakes it on stability. As for random reads, AWS is the favoured in both those categories. Finally, for random parallel reads, AWS beats both other providers for performance (median at 18560 $\mu$s) with gcp acing stability (with the lowest standard deviation).
Conclusion
It is important to note that random access seems to be outperforming sequential ones in both operation types, which is impossible whether it is in the case of an HDD (time to seek to random segments of the disk should add up to a higher latency) or of an SSD (the overhead cost of initiating IO operations should make random access less performant). This observation can possibly be explained in part due to the fact that the total size of the file written to disk exceeds the default SSD size attached to the machine which would then require scaling up or adding a PV, causing the higher latency.
If the following hypothesis were true, we can confirm the observation that none of the provider file system performance outperforms each other in all disk access pattern. And that for overall file system performance, one should choose AWS and for stability GCP.
Redis — key value data stores
The redis benchmark is based on creating equivalent computing instances (VMs in Azure, EC2 instance in AWS and Machines in GCP) running a single node redis database and querying it (with update, read and insert operations) from multiple computing instances each running a specific amount of threads (the amount of threads being the varying parameter between metric measurement). As redis is an open source (BSD licensed), in-memory data structure store, used as a database, cache and message broker, this benchmark would also give an idea as to the efficiency of in memory storage in each of the respective provider computing instances.
We mainly base our comparison of redis performance on throughput and latency. As those two are closedly tied together, the data collected mainly focuses on the former which is the number of operations processed by the database within a given period of time. Graphing the throughput evolution per concurrent server (redis) threads and fitting it to a function would give an idea of the performance for redis that can be gained from vertical scaling. Fitting the distribution with a logarithmic function works perfectly with AWS and Azure with a low coefficient of determination ($R^2 \geq 0.97$) but not well with GCP.

Redis throughput (req/s) per number of server threads
- aws ($x : 7312 \times ln(x) + 1433 $ and $R^2 = 0.971$)
- azure ($x : 6476 \times ln(x) - 2038 $ and $R^2 = 0.981$)
- gcp ($x : 17195 \times ln(x) + 33993 $ and $R^2 = 0.729$)”
Each provider reaches an optimal throughput after a certain point and the growth is then stunted. This plateau occurs at $100 000$ requests/sec for GCP, $40 000$ requests/sec for AWS and $35 000$ requests/sec for Azure. GCP is therefore the most fitted for redis database hosting.
MongoDB — document oriented databases
MongoDB is a general purpose, document-based, distributed database. The mongo YCSB benchmark (Yahoo! Cloud Serving Benchmark) is meant to provide a well rounded picture of a system’s performance using in our case a database with 1000000 records, with an equivalent client machine performing 10000 operations with 32 clients with a varying proportion of read, insert and update and 1 server machine serving with 32 threads.
Using the percentile distribution of the latency (in ms, scaled down to logarithmic scale) for certain CRUD operations (read, insert, update without bulk or delete operations) in Mongo yields the following graph:

(a) insert |

(b) read |

(c) update
Write latency (ms)
Read operation latency is unsurprisingly the lowest in all providers with GCP latency quantiles being consistently the lowest. As Insert operations will add a document to a collection if it does not exist, it is in general more expensive, having to both read for document’s existence and write to storage. The previous observation regarding the GCP deployment’s performance is similarly observed in (c).
Finally, Updates correspond to modifying an existing document which entails reading the database for the document, then if it exists, seek the memory address corresponding to the modified field and access it to overwrite the old value. This extra cost is reflected in all providers as their medians exceed that of any other operations. Although AWS’s median latency is the lowest, from the 75-th percentile onward the operation explodes exponentially in cost, making it less viable than GCP.
In conclusion, GCP is the provider of choice for deployment a Mongodb database. It would however be interesting to include more data regarding different composition operations and add the cluster size as a parameter (the above only relevant to a single cluster mongo).
Cassandra — column oriented databases
Cassandra is a distributed, column oriented database designed for high data loads and high availability through clustering. Implemented in Java, evaluating its performance would not only give insight into the performance of an optimized Java application but also the networking throughput between nodes of the cluster.
The test runs cassandra-stress (stress test utility maintained by the cassandra team themselves, and thus, we can suppose that it is agnostic as to the underlying provider) on a three node cassandra cluster hosted on three instantiated machines within the same sub region of the cloud provider on the QUORUM consistency level (A write must be written to the commit log and memtable on a quorum of replica nodes across all data centers). The data loaded corresponds to the one proposed by the Cassandra YCSB test, consisting of $2000000$ partitions stored in a single keyspace (a number of partitions corresponding to huge applications, which is the intended use case of cassandra).
| provider | mean (ms) | median (ms) | p95 (ms) | max (ms) |
|---|---|---|---|---|
| aws | 34.7 | 25.4 | 82.8 | 824.3 |
| azure | 34.5 | 20.5 | 93.7 | 475.7 |
| gcp | 16.4 | 26.4 | 58.4 | 8191.9 |
Latency statistics for cassandra mixed workload
With the previously mentioned workload, a common trend can be observed in all cloud providers that the latency distribution is positive-skewed with the mean being significantly higher than the median due to high outlier values. In both mean and median, GCP wins out over the others despite an extremely high max latency.
Networking
Instance throughput
Iperf is a tool for active measurements of the maximum achievable bandwidth on IP networks. This benchmark creates two equivalent machines, each allocated an external IP that communicates with each other through these IPs (IPv4 to be precise) for 60s.
Measuring the throughput (the amount of packets that can be passed through the virtual/physical networking layer - an extremely rich metric that can be affected by medium limitations (underlying networking equipment data rate), congestion (and congestion handling), protocol, etc…) of the previous operations on multiple iterations will give us an insight into the real networking performance of instances and compare them to the advertised bandwith (the theoretical throughput guaranteed by each vendor).
| provider | Mean throughput (Mbits/sec) | Stddev throughput (Mbits/sec) |
|---|---|---|
| aws | 301.5 | 10.595 |
| azure | 501.75 | 0.433 |
| gcp | 1967.25 | 2.586 |
TCP IPv4 throughput (Mbits/sec) per provider
Due to relatively low standard deviations observed and the high amount of iterations, it can be remarked that GCP instances seem to have the highest throughput with the other providers seriously lacking behind. However, an appropriate measure of the bandwidth is not standardized (each provider uses his own metric for bandwith measurement, GCP publishes Network egress bandwith (Gb/s), Azure publishes the Max NICS (Network interface controller) and AWS qualifies network performance as Low, Moderate or High without further elaboration) accross cloud platforms nor is it public, thus, making a comparison between network throughout and bandwidth impossible.
Webserver latency

Latency percentile (log ms) distribution for NGINX
NGINX is a web server which can also be used as a reverse proxy, load balancer, mail proxy and HTTP cache. This benchmark runs an NGINX server instance on an equivalent machine with 1 cpu and 1 thread and another exactly similar machine running as a client within the same region. The client runs a wrk2 tool with a sampling interval of 100msec for a duration of 60s, the results from which a latency percentile distribution is extracted. This doubles as a proof of concept as to the theoretical performance of the nginx ingress controller (purely hypothetical as the nginx ingress controller uses a modified image of NGINX with more overhead) used in the vulnerability-assessment-tool-admin helm chart.
From the results, GCP consistently outperforms other vendors with the lowest latency in all measured latency percentiles. It is important to note that the observed criteria does not cover the whole spectrum of possible deployments; multiple CPUs (which directly influence the reverse proxy’s throughput), SSL serving, caching efficiency, etc… The lack of benchmarking environment disclosure by the PerfKitBenchmarker tool rears its ugly head once again as the test conditions have to be extracted from the source code.
k8s Cluster DNS resolution
Evaluating the performance of the hosted control plane is a relatively tough task due to the multiple variables that need to be accounted for (k8s version, base image and specs for the node pool, security and monitoring options that all affect performance). Using the perf-tests toolkit gives either resource heavy tests (some even requiring to reach the k8s design limit for nodes in the cluster, around 100) or inconclusive tests.
The test to quantify the DNS name resolution latency accross was inconclusive as the precision of the data set collected is too low to distinguish between cloud platforms. Because of either the lack of precision in the data gathered or the extremely similar cluster configuration defined, all providers’s k8s control plane display the same latency. However, despite this, we discovered that GCP only deploys a KubeDNS server whereas the other two deploy both a CoreDNS and a KubeDNS server. Although both are DNS servers, CoreDNS (introduced in k8s as a General Availability and replaced kubeDNS as the default name resolution server) offer better performance for external domain name resolution and the latter for internal name resolution. This design/technical choice may come from Google Public DNS’s dominance in the Internet space and GCP being in the same networking abstraction as the latter.
Ease of Automation and Tooling
Unlike previous sections, assessing the ease of automation and tooling for each platform is purely subjective and strictly based on the appropriate use case. As such, from this point, this work assumes the deployment previously described scenario; a k8s hosted control plane connected to a hosted database via a VPC bridge.
Azure
The azure terraform modules is loosely divided into three providers:
- Azure: used to configure infrastructure in Microsoft Azure
- Azure Stack: used to manage resources in Azure Stack
- Azure Active Directory: used to configure infrastructure in the Azure Active directory
The quality of the documentation for the Azure terraform modules are very poor, with object description being quite lacking and dispersed throughout three different providers whose distinctions and use cases are never explained in any documentation. This partially reflects Azure’s preference for UI based approach to infrastructure provisioning over “automation”.
AWS
Unlike Azure, AWS’s terraform modules are centralized in an unique provider titled aws. In order for terraform to gain resource creation privileges, a service access key must be passed (safest method as hard coded credentials in terraform files are displayed as plain text) through a set of given environment variables.
AWS also maintains open source modules that abstract the complexity of the base objects. For instance, the terraform-aws-vpc library simplifies a VPC creation to a single declaration block in place of around 10 base object declaration blocks using the “native” module. However due to upstream implementation issues with AWS’s APIs, these libraries inherited a flaw which renders infrastructure teardown impossible. As such, external tools such as cloud-nuke are mandatory in order to clean up these failed destruction attempts.
Unlike EKS or RDS, no prebuilt module exist for creating the bridge mentioned. Unlike GCP, little to no examples or documentation are available to guide the provisioning of this architecture. This ultimately boils down to creating the aws_vpc_peering_connection object with the auto_accept argument set to True after the following objects are created:
- EKS cluster with its own VPC (EKS_VPC_ID)
- RDS (Postgres) with its own VPC (RDS_VPC_ID})
- Peering connection initiated from the RDS VPC to the EKS VPC
- Route table for public subnets of EKS cluster is updated: route with destination RDS_VPC_ID and target peer connection from step #3 is added.
- Route table for the RDS is updated: route with destination EKS_VPC_ID and target peer connection from step #3 is added.
- The RDS security group is updated, new inbound rule is added: all traffic from EKS_VPC_ID is allowed
GCP
Similarly to AWS, GCP’s module are centralized and accessible by passing a JSON file storing the credentials. There are no clear line as to which method of credentials storing (env variables or filesystem) is more secure so terraform secret management remain contentious for every provider.
The CloudSQL (hosted database) automated creation is one of the most tricky object in the GCP terraform module, although still a mile ahead of AWS when it comes to simplicity. Connection the GKE cluster to the CloudSQL database requires a private IP address within the same VPC as the cluster.
resource "google_compute_global_address" "private_ip_address" {
  name          = "private-ip-address"
  purpose       = "VPC_PEERING"
  address_type  = "INTERNAL"
  prefix_length = 16
  network       = data.google_compute_network.default.self_link
}

resource "google_service_networking_connection" "private_vpc_connection" {
  network                 = data.google_compute_network.default.self_link
  service                 = "servicenetworking.googleapis.com"
  reserved_peering_ranges = [
      google_compute_global_address.private_ip_address.name
  ]
}
GCP GKE-CloudSQL peering terraform declaration
The declaration heavily simplifies the AWS creation steps previously mentioned whilst keeping the peering logic clean and human readable.
Conclusion
This small test case using terraform, although not representative of the whole image when it comes to automation on each platform, shows that for ease of usage GCP wins over the competition and thanks to the richness (with complexity being the side effect) of its object, AWS is more suited for larger infrastructure and stricter security enforcement.
Key insights and conclusions
When it comes to both overall performance (instance, database, networking) as well as automation intuitiveness and easiness observed through the previous benchmark, GCP edges out its competitors. AWS, on the other, despite its flaws with terraform automation makes up for it in more granular infrastructure building blocks as well as filesystem efficiency. The observation resulting from the PerfKitBenchmarker should however be taking with a grain of salt due to the inherent defects of the tests that compose the kit (lack of transparent environments, machine type biases, etc…). These results are collaborated by the ones collected by the Cockroach Lab 2020 Cloud Report shows that GCP edges out its competitions on performance but also notes that the cloud providers performance are bound to constant fluctations as they adopt new hardware, new infrastructures and new processes.
Another key insight obtained is the cost and performance gained from using the hosted database as a service of the given cloud vendor for larger dataset which highlights the advantages of standardizing deployments across security research and testing projects.